Having insight in the energy flows of your buildings, that is where it starts! With these solutions you can see this information per building, you can benchmark energy performance and you can make reports.
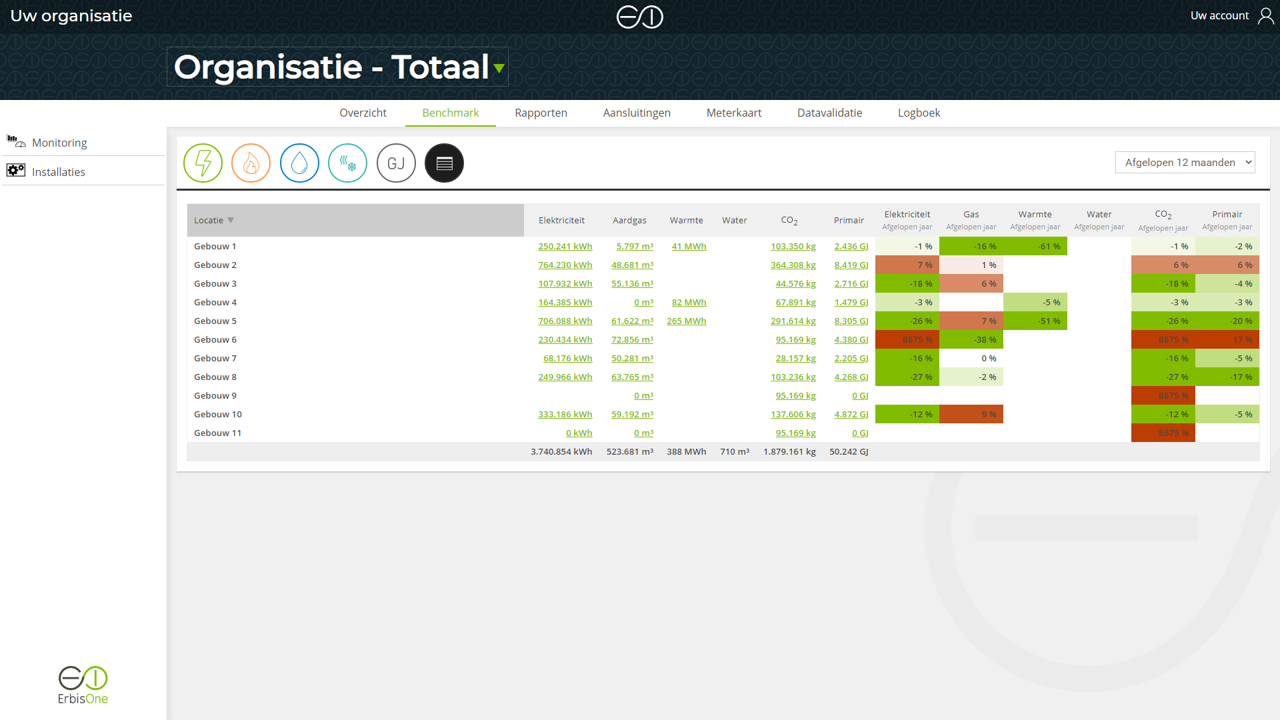
Benchmark the buildings and/or building parts within your organization and discover per energy flow which buildings perform best in terms of energy and which buildings require extra attention. By also including previous consumption in the benchmark, you also gain insight into the highest declines and risers within your property portfolio.
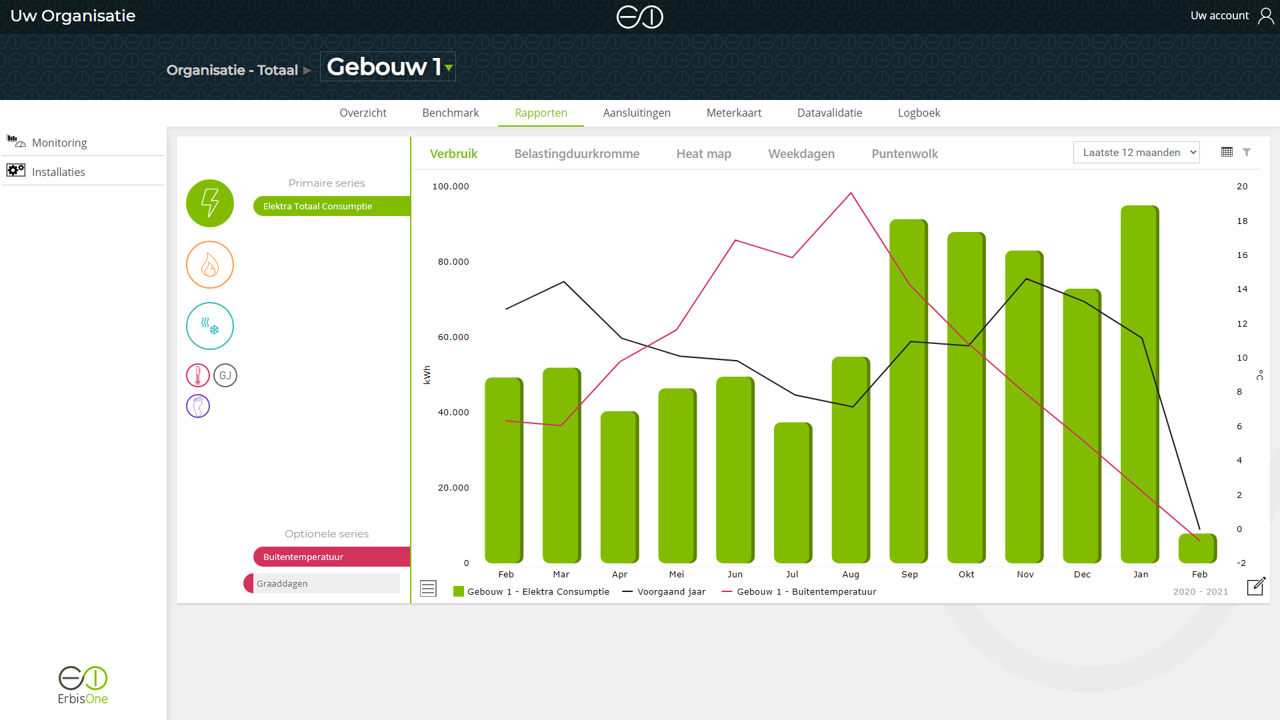
With the reports in ErbisOne you get a complete picture of all your energy flows at organization, building and/or meter level. View consumption and generation of different periods in different intervals. By using filters, notes and other variables you get 360° insight into your energy flows!
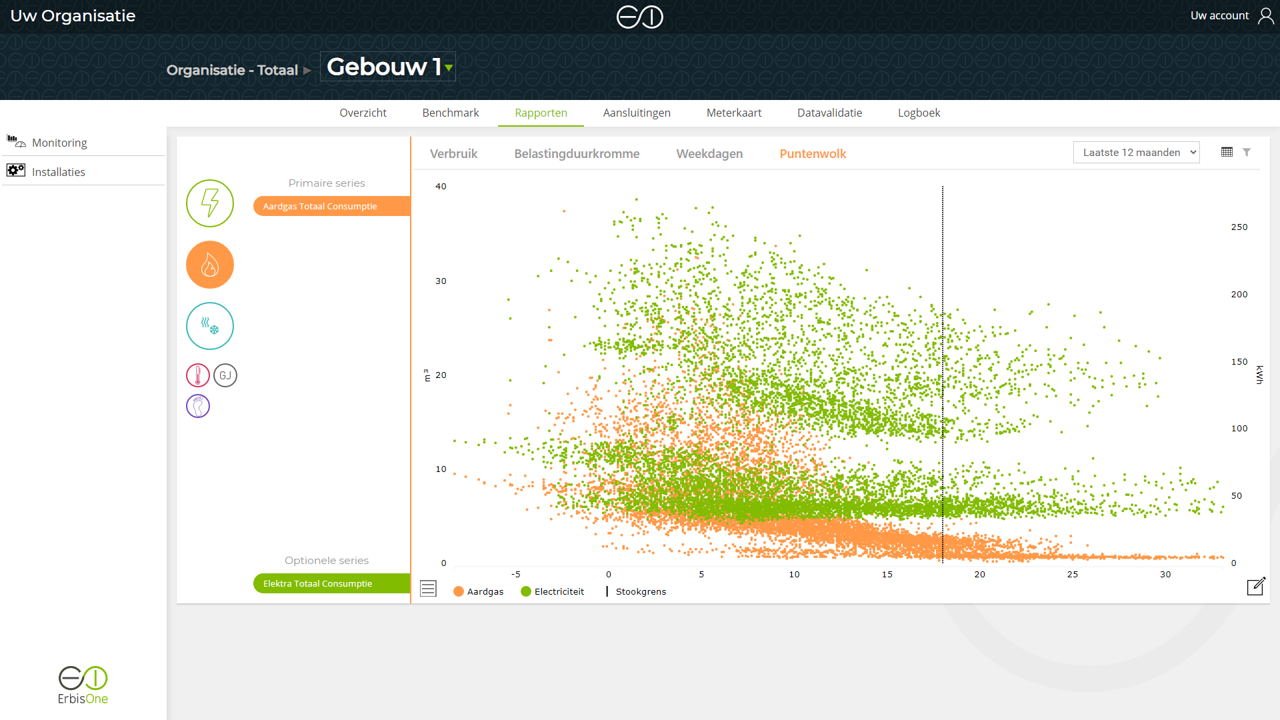
Based on your energy data, ErbisOne automatically generates a number of useful analyzes for saving energy and preventing energy waste. Using energy profiles, scatterplots and heat maps, you can reduce the base load, peak power and ensure optimum adjustment of installations.
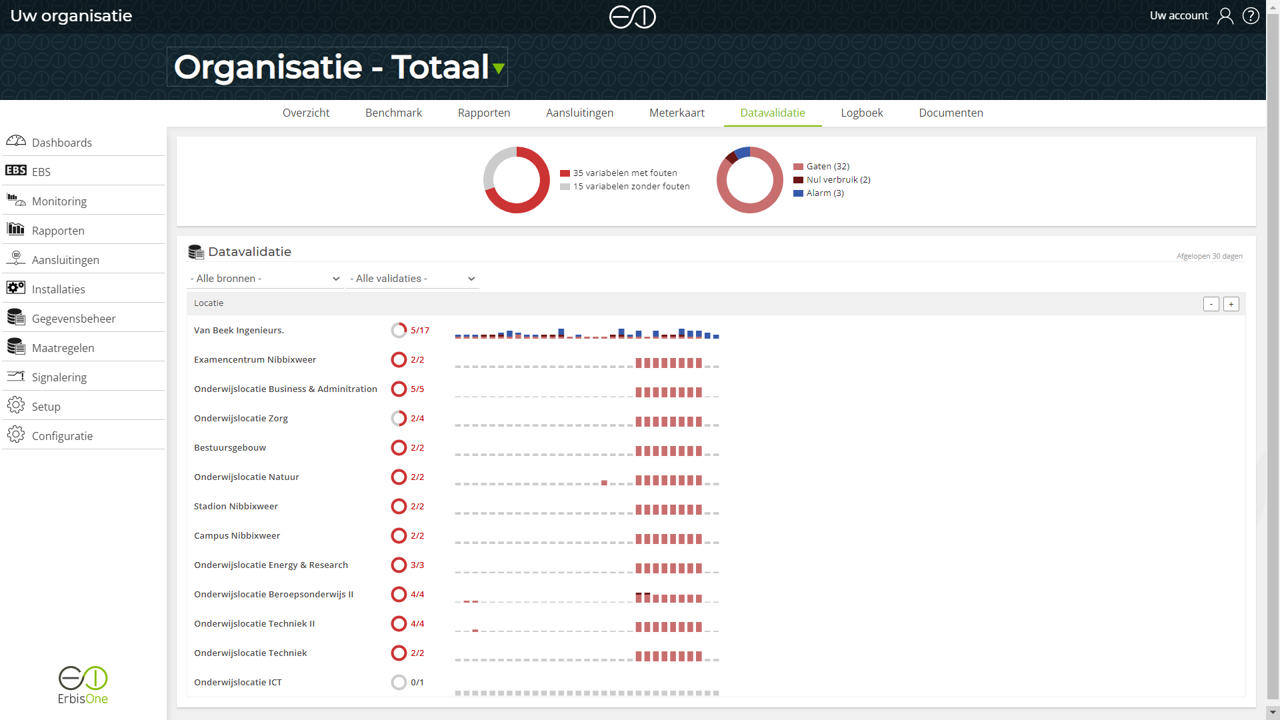
Prevent energy waste by monitoring your consumption. Set limits based on historical consumption, standards and more. Be warned when limits are exceeded and act immediately! This way you always have control over your energy flows.
In addition to the many insights that ErbisOne offers based on the standard reports, analyzes and dashboards, it is also possible to create your own dashboards! With the Dashboard builder you can add graphs, tables, diagrams etc. to your dashboard with an extremely user-friendly drag-and-drop system. This way you can create unlimited dashboards that match the information needs of your organization!
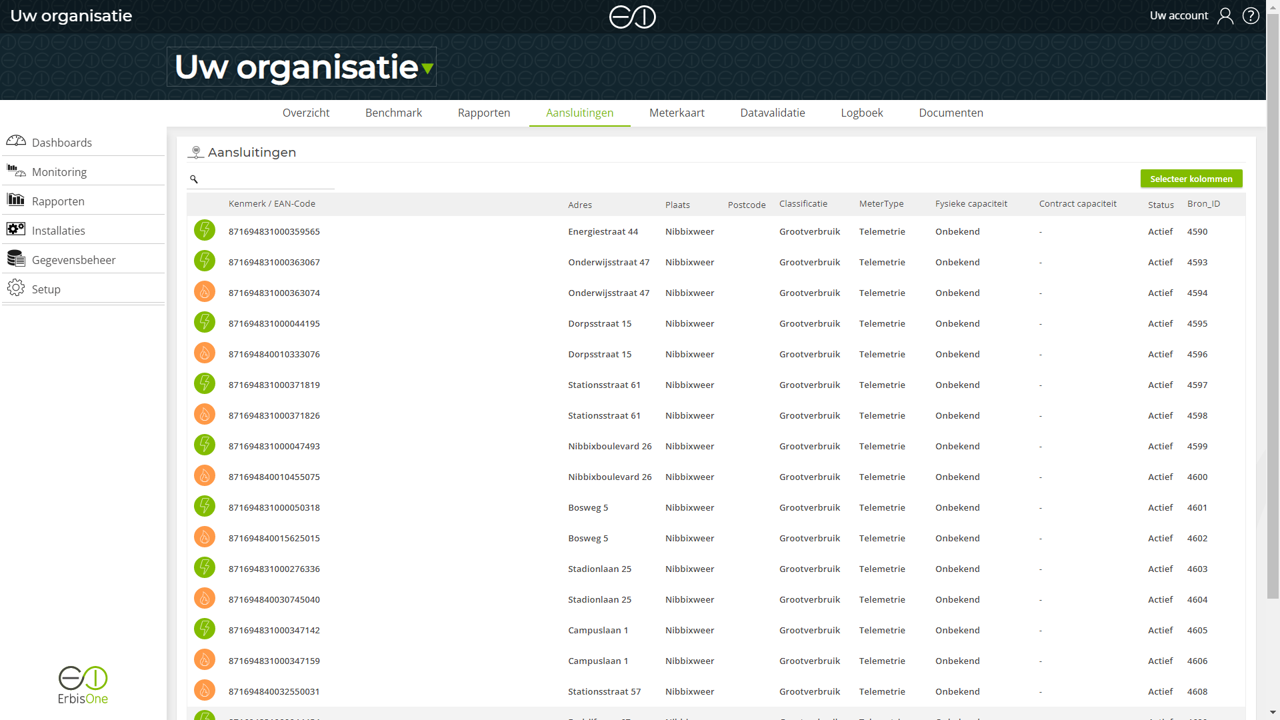
In the connection register of ErbisOne, the connections of all your energy flows are clearly displayed. Simply navigate through the connection register with the search and sort functions and access all essential information related to the supply points at the touch of a button.