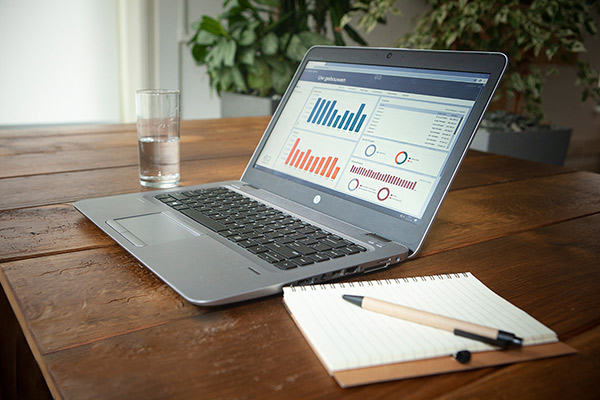
In the user friendly webbased ErbisOne portal the energy data is processed and shown in clear reports. This way you keep insight in your energy flows. The ErbisOne portal is one of the possibilities through which you can clearly visualize energy data.
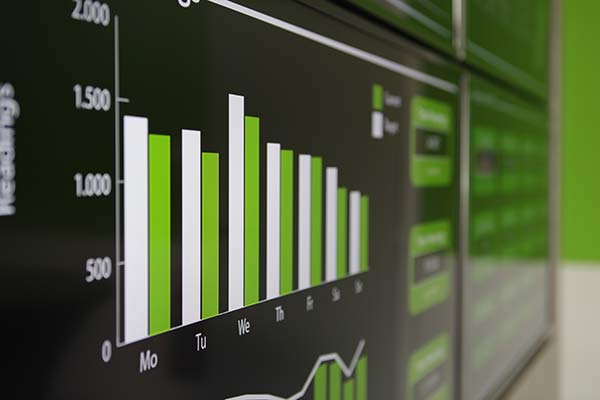
Visualizing and sharing energy data in the form of dashboards, reports, analysis and presentations contribute to a successful energy policy. In my last blog you have seen the visualization methods of the ErbisOne Energydisplay. By sharing energy data on information screens, like you can do with the help of the Energydisplay, you can share your energy achievements with internal and external stakeholders. This way your organization works towards more awareness and acceptance of your energy policy.
More and more organizations want to take that extra step and want to share their energy policy and achievements widely in an interactive way with different stakeholders. They have the need to share more (technical) insights, or want to immobilize their target group through the use of visuals. For organizations which need a form of visualizing which one-on-one suits their organization, energy policy, goal and target group, ErbisOne offers customized dashboards.
Customized dashboards
A customizes dashboard is really nothing more than a website. A website in which you can share energy data, -targets, -presentations and/or other information with internal- and/or external stakeholders. Which information this is and how you want to show this is up to you. You literally decide the substance of every pixel on this page, which by the way is the biggest advantage compared to the possibilities in the ErbisOne portal. In customized dashboards you work with the same data as in the portal and enjoy the same speed and reliability, but with customized dashboards you are completely in the lead to shape this.
With the ErbisOne Energydisplay you also decide which information you want to share and how this is visualized. An Energydisplay and a customized dashboard both are suitable to send extra information. The big difference is that a customized dashboard has the extra advantage that it is completely interactive and ‘clickable’.
Goal and target group: what do you want to show?
Creating appealing dashboards or presentations is of course not a goal itself, but just a means to transfer certain information to your target group. Of course it is also important to think beforehand what the goal is of the visualization in combination with the target group. Always start with the question who do I want to give access to the information and what information do they need. If it concerns visualizing energy, you can literally go in ‘all directions’. For example you can offer a technical dashboard with detailed information about installations or a complex production process. Or your organization has many different locations which you want to show graphically in a map. These are just two examples of the infinite possibilities that customized dashboards offer. In the text below I shall share a number of application areas of customized dashboards by using different examples used in practice.
Inform
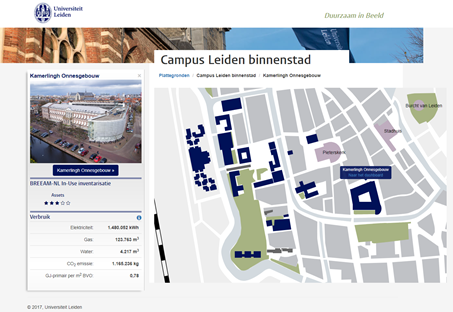
Sharing information about your energy policy creates more awareness and acceptance with your target group. This is a part of successful energy management which cannot be missed. With a customized dashboard you can show your internal and external stakeholders your energy policy in an interactive way by sharing nice visualizations, like maps, graphs, diagrams and pictures. A nice example is the website ‘Sustainability on screen’ from the Leiden University. This university shares in an interactive (clickable) map the energy data of all her buildings within her campuses. The university sees it as her social duty to work together with employees and students on making environmental measures visible and creating awareness, and want to set an example towards others (source: Sustainability on screen, Leiden University).
Technical management
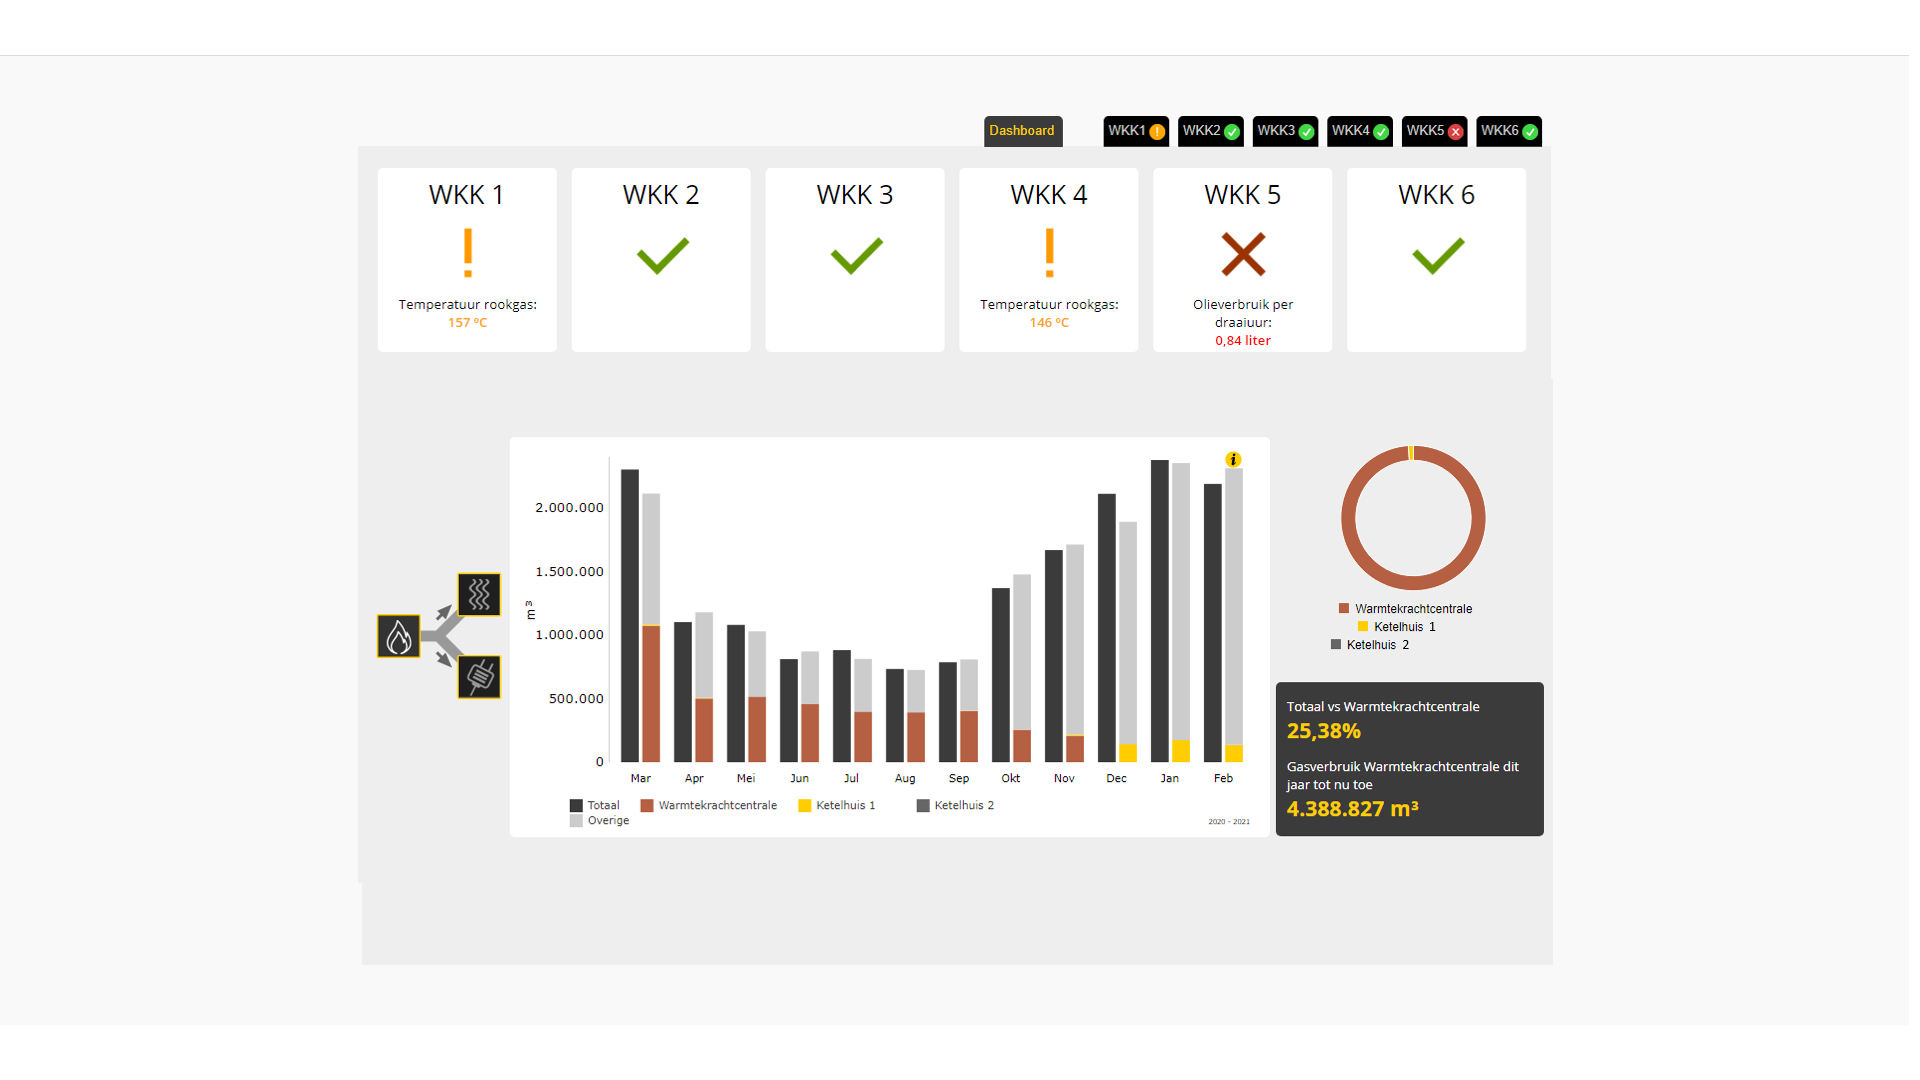
Having insight in all energy flows is certainly not only for informing external stakeholders, it is at least as important for all departments within an organization which have to do with energy management. Think about the technical installation management, facility management but also the financial management. With a customized dashboard you create an environment through which you can execute the different forms of management, by showing the right data which are essential for this. Think about the right parameters, KPI’s, alarms et cetera. In the example below you can see an example of a customized dashboard for controlling multiple CHP installations. Based on this dashboard it can easily be seen where action has to be taken regarding attention points in the production installation.
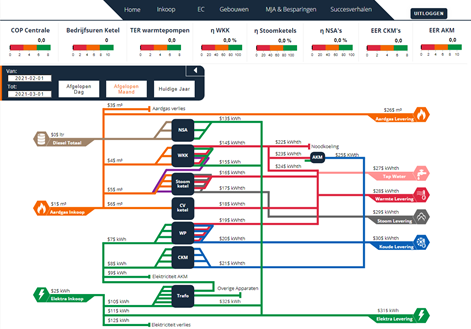
Schematic view of complex processes
In complex environments and processes, for example in large hospitals, large energy networks and complex production processes, it is hard to clearly show all energy flows. Also here a customized dashboard can offer a solution. Where in a standard environment it will be impossible to visualize your unique and complex situation clearly, you can realize this with a customized dashboard. In a good customized dashboard you can see in one overview where and how much energy is used, and how the energy flows run. In the example below you can see how different energy flows in a complex energy net are made visible through the use of a customized dashboard. This way it is also possible to continuously show your energy balance (the distribution of the energy flows within your buildings).
We create your customized dashboard!
Every organization is unique and asks for a different approach. In most situations this can easily be put into a standard portal, but in reality there are many situations where a more comprehensive form of visualizing becomes necessary, like shown in the earlier described examples. These examples show the possibilities of a customized dashboard, but as indicated earlier the possibilities are limitless. You decide the goal and the target group of the dashboard and together with our developers you can process this into a high-end, interactive environment which fits your issue and organization.