ErbisOne is the powerful platform which transforms data from your buildings into reliable information which companies can use to take the right steps towards a successful energy transition. Many well known organizations in the field of retail, education, care, government and industry have been working with our ErbisOne platform for a long time.
Inzicht in zonnepanelen
When you have installed solar panels on your building, of course you want to have insight in the functioning and performance of these installations. By importing data from your solar panels in ErbisOne, you gain insight in the generation, feed-in, efficiency(-expectation) and (expected) payback period. In this third blog from the series ‘Featured! ErbisOne’ I will show you how you keep grip through monitoring on the performance of your SolarPV installations (PV=PhotoVoltaisch).
From data to relevant information
ErbisOne transforms data in lightning speed into reliable information, this is also the case for data from your solar panels. With ErbisOne SolarPV data can easily be imported thanks to the currently available datalinks. Through the datalinks, data can be imported from the data company (gross production meter), from the BMS, dataloggers, but mostly from the supplier itself by using an API-link (like for example SMA, SolarEdge etc).
Despite the source of your data, it is automatically checked and validated in the Data Management Center of ErbisOne. This way you only see reliable data from your solar panels. When there are deviations in the data (production in the night, not enough production during the daytime, missing data etc.) you will be informed about this in the ErbisOne portal. This guarding and signaling of within ErbisOne has shed a light on many cases which the owner of the installation wanted to know like:
In practice we assume the installation always works as it should, however because the installation often can’t be seen easily (often it is located on the roof), it is important to have and hold a grip on the correct operation.
Standard ErbisOne SolarPV report
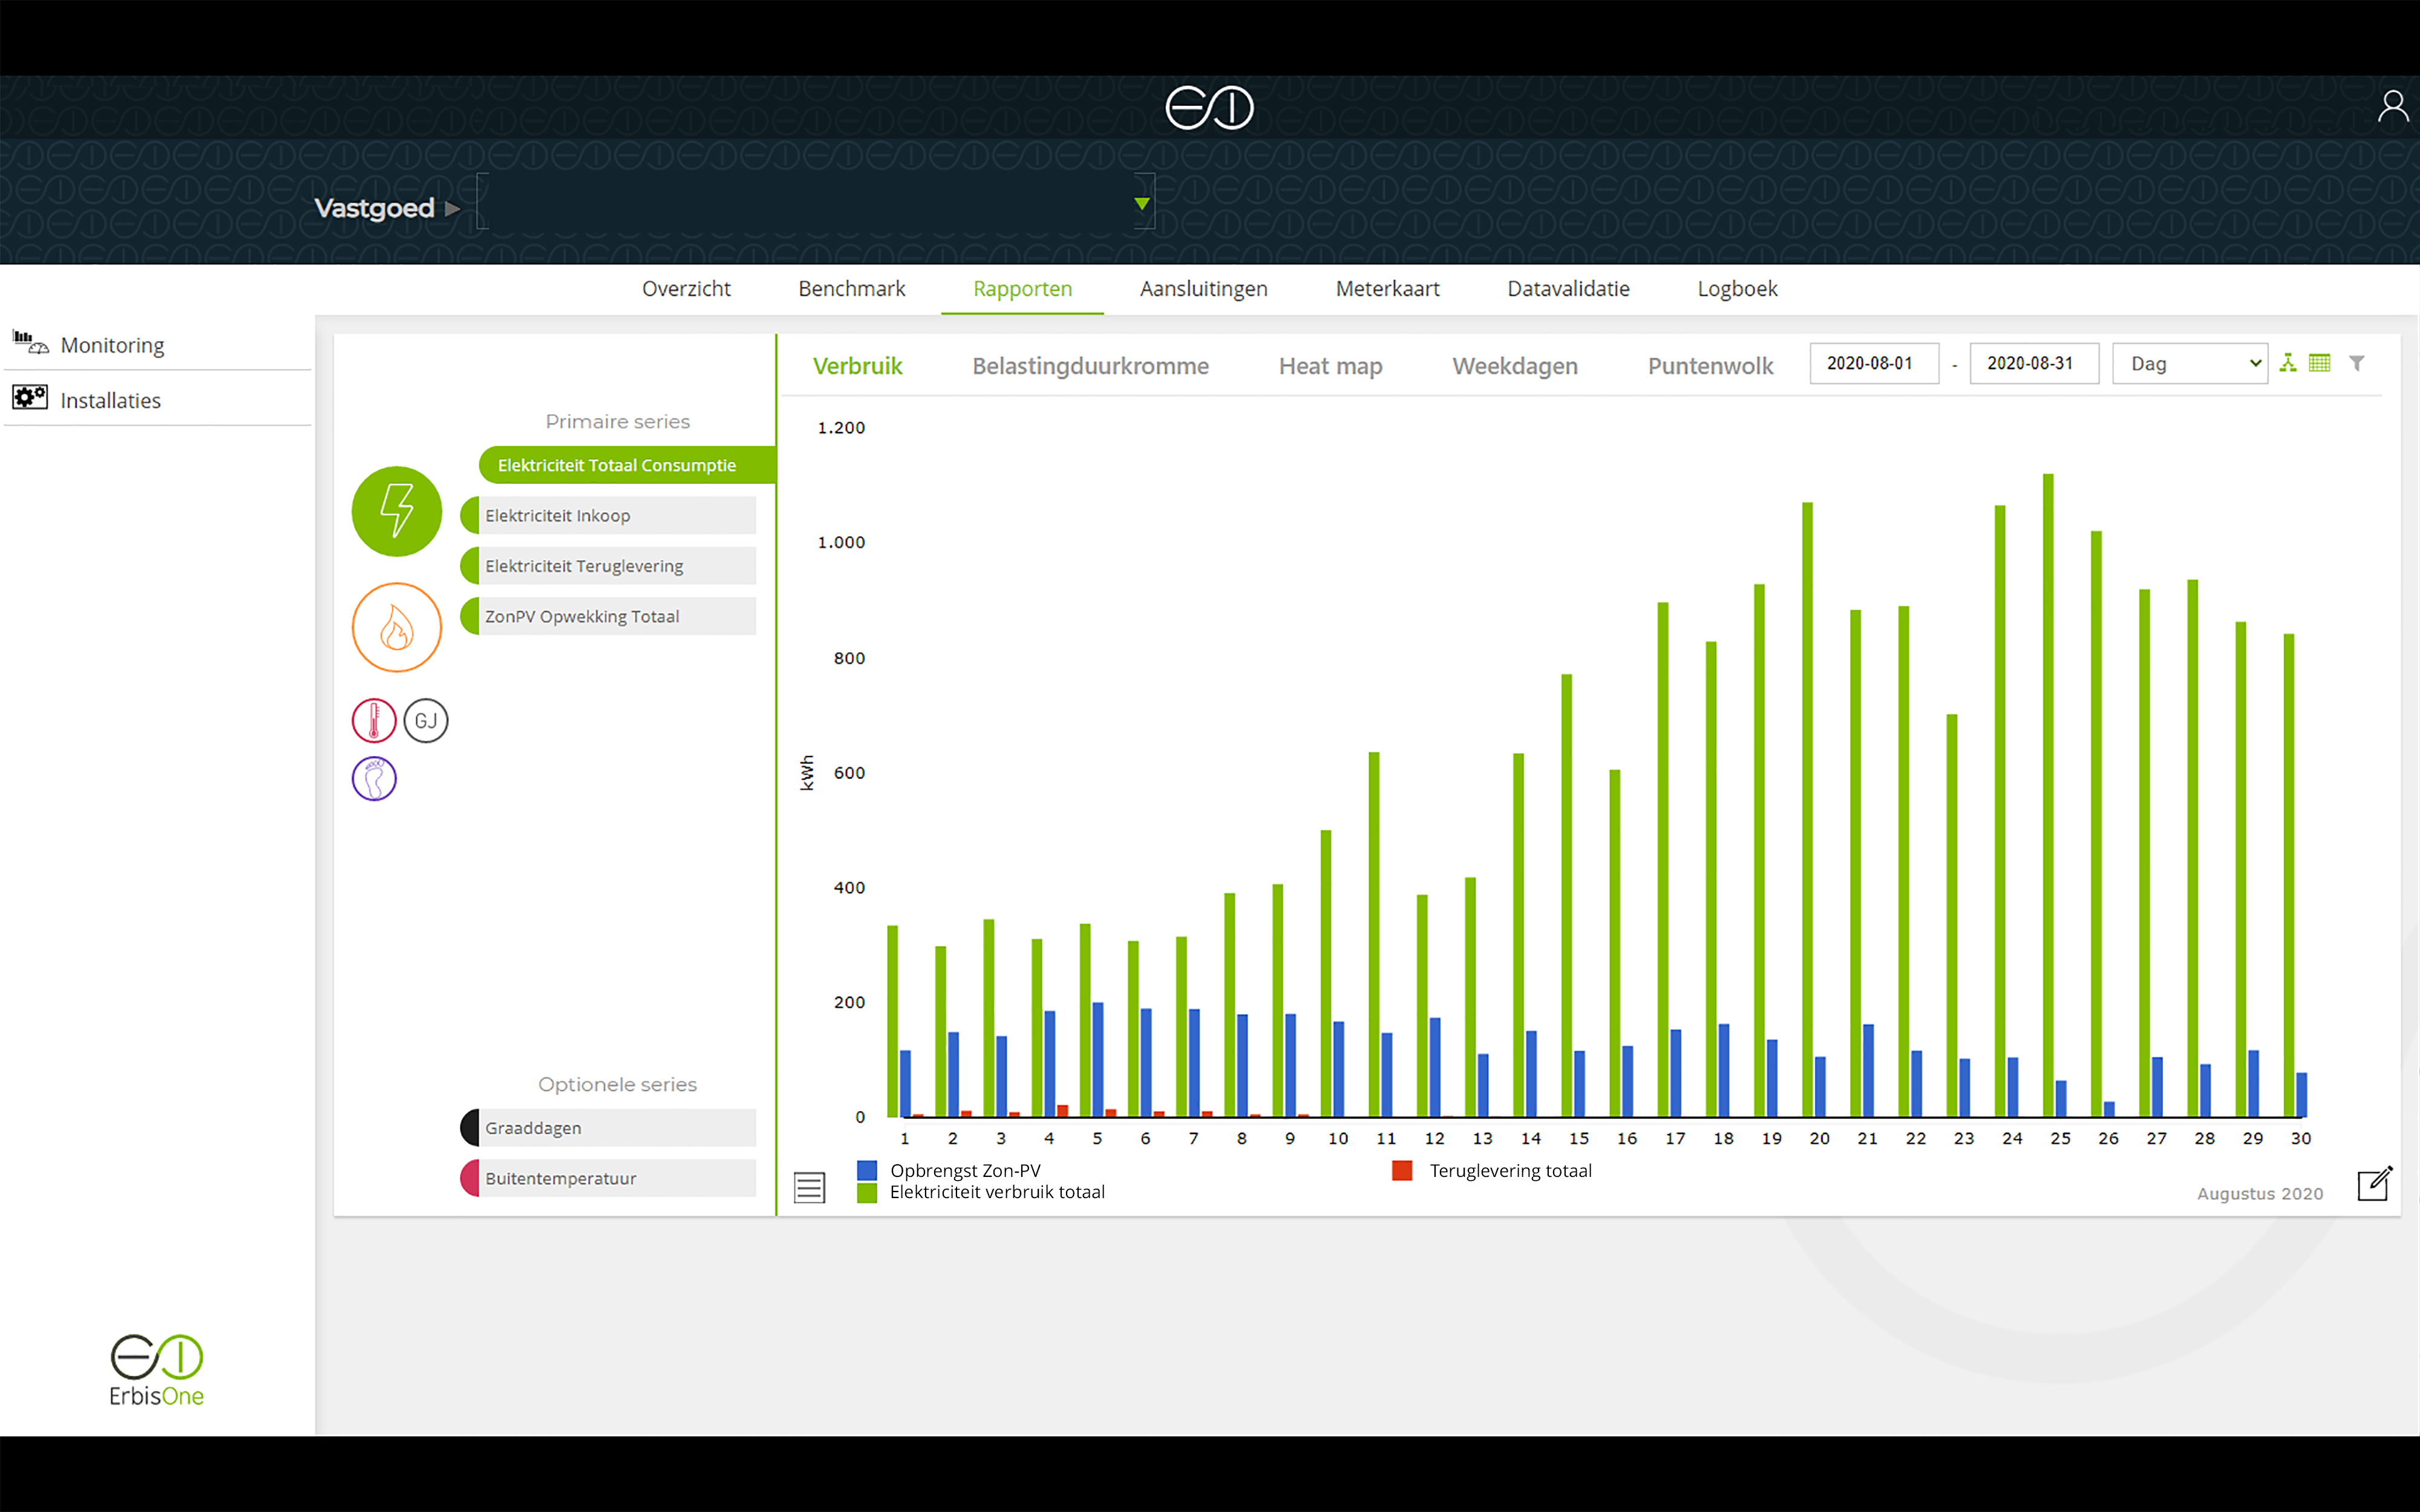
SolarPV data is submitted into the consumption report of ErbisOne by default (also read blog 2). Besides the normal energy flows in your building you can also find the energy production of your solar panels here. It is also possible to compare the produced energy to other data like for example the solar radiation and the production data from last year. Also the report offers you insight in the feed-in, but also the distribution between the purchased electricity and your own energy production. That last part is often not possible for other SolarPV displays.
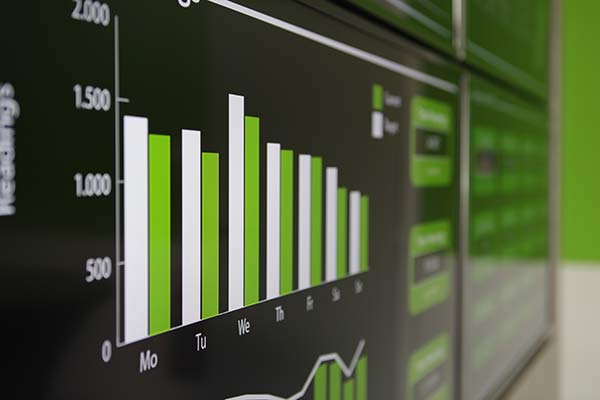
Underneath you will find an example of a standard consumption report which includes the total energy consumption (green), the total SolarPV production (blue) and the feed-in (red).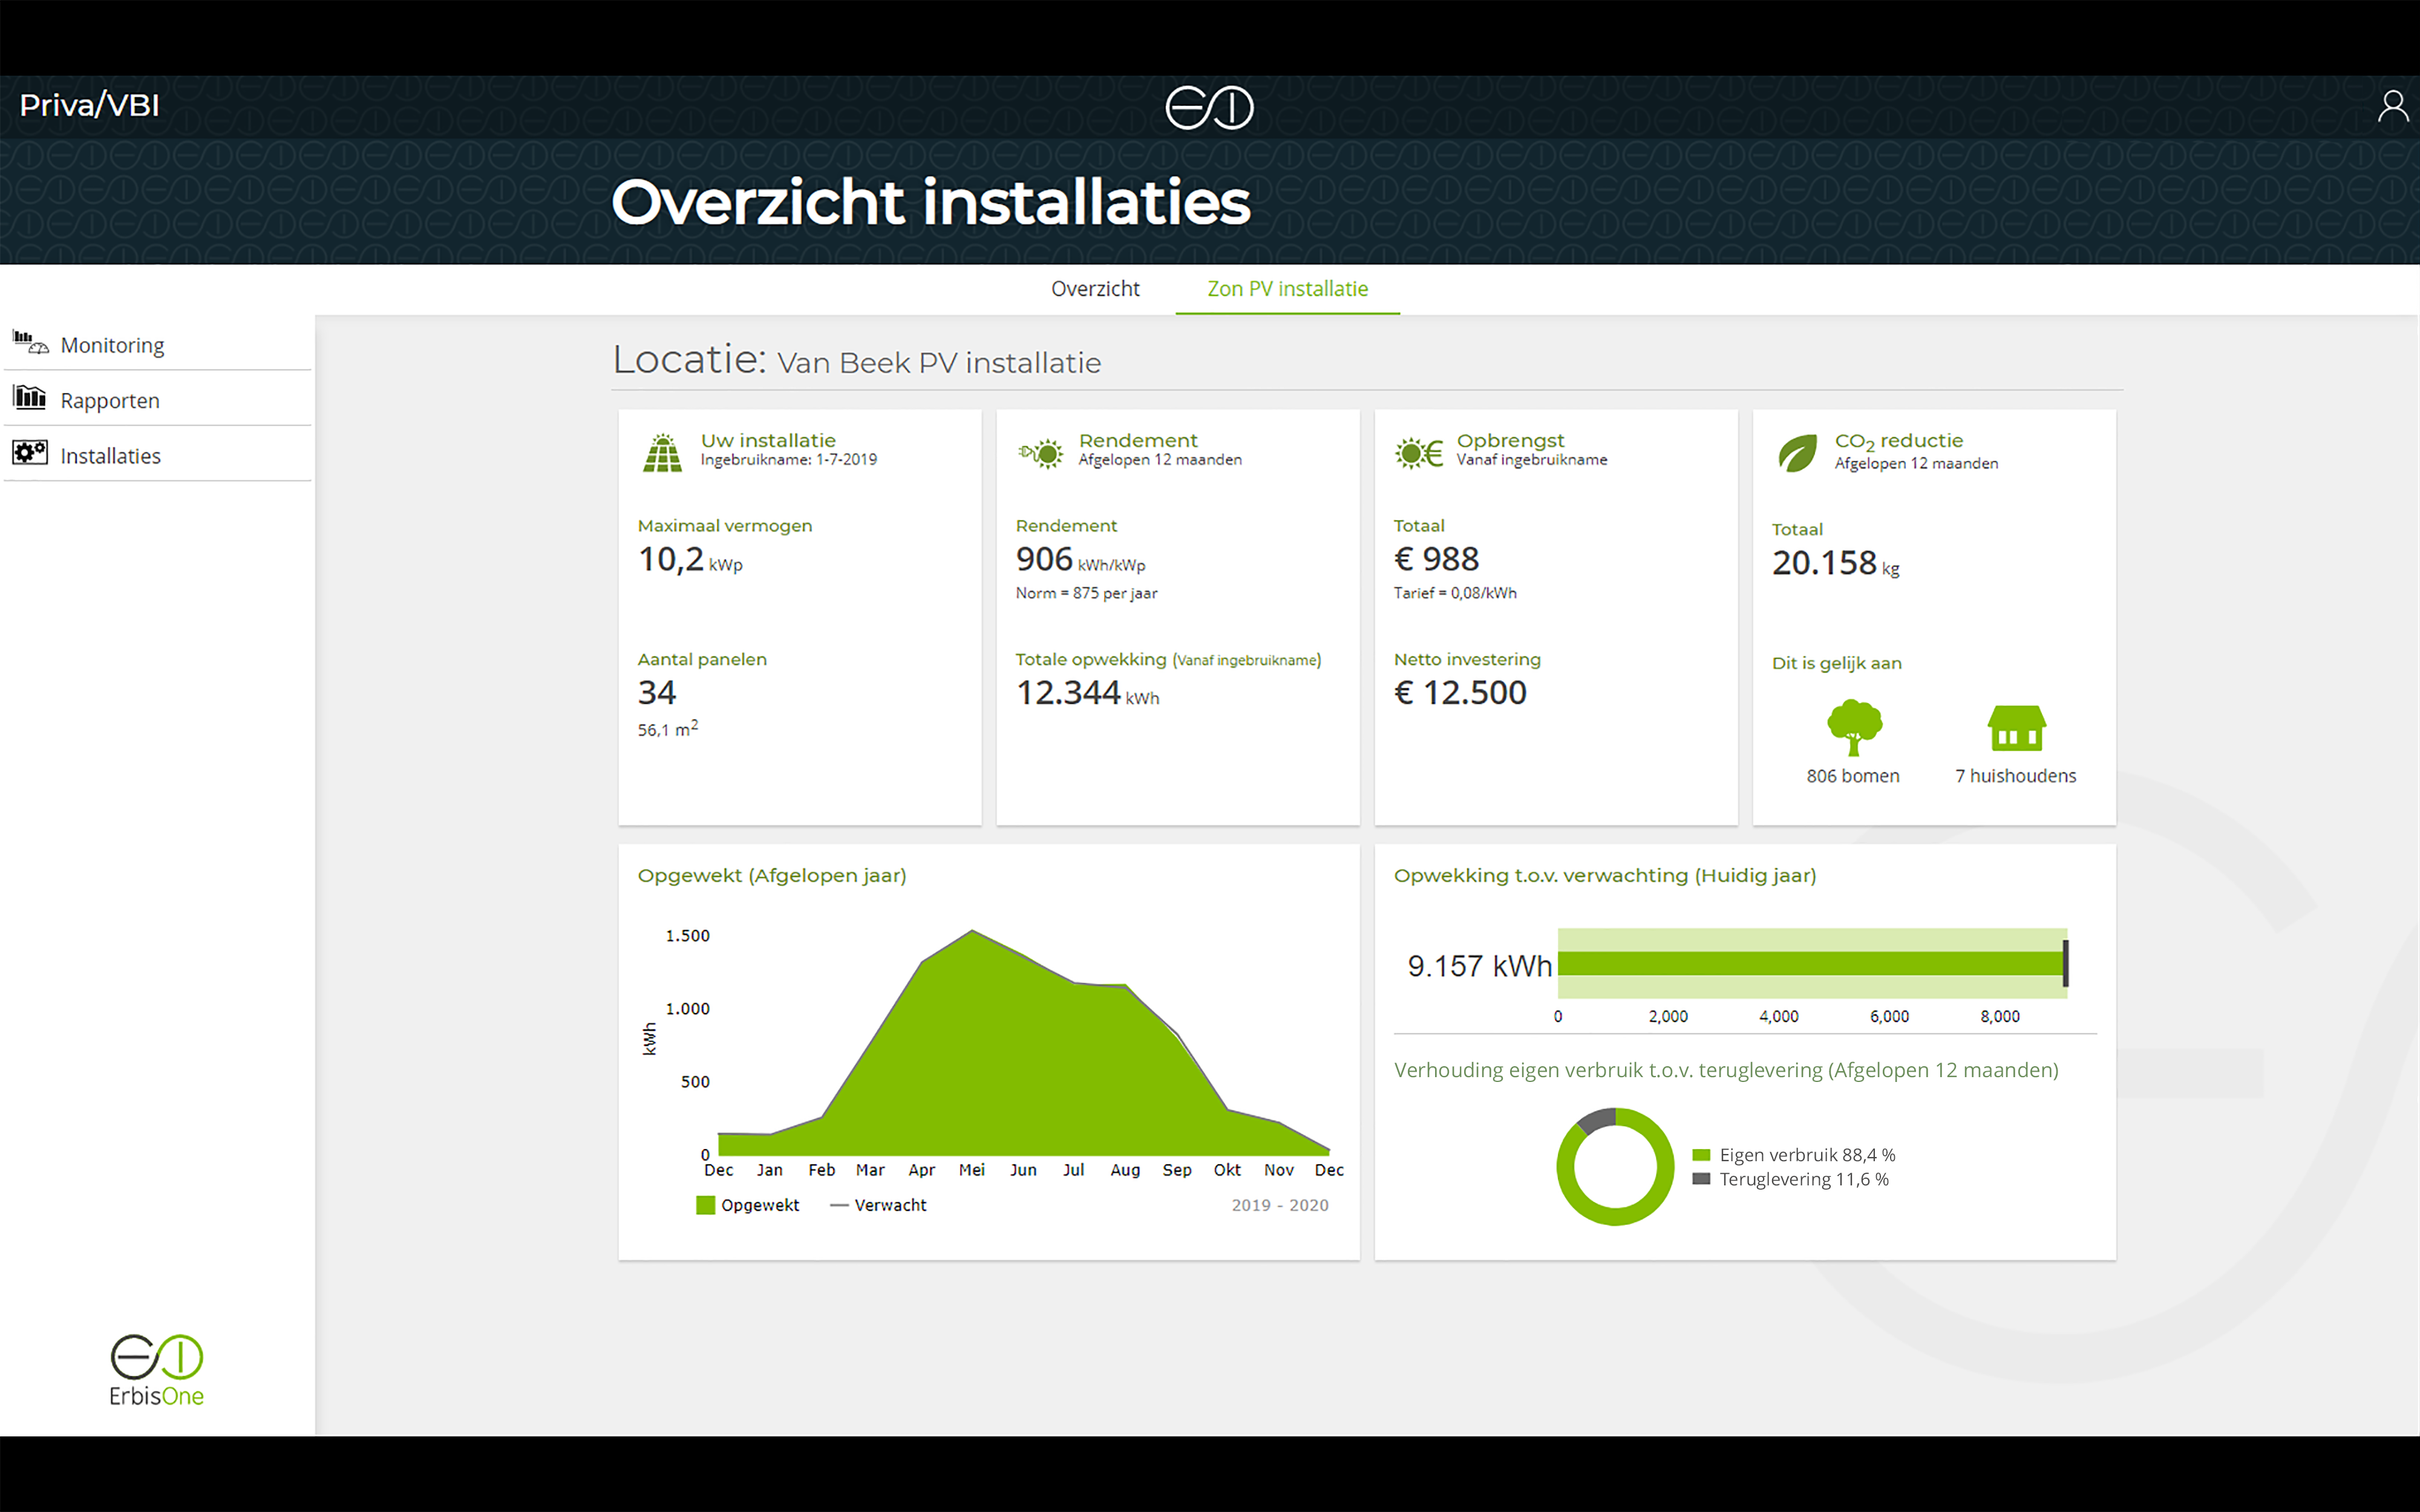
The Solar PV dashboard
Especially for users with solar panels ErbisOne has developed the SolarPV dashboard. This dashboard offers a very detailed insight in your SolarPV installation in a visually attractive and clear way. In the dashboard you can see general information concerning your installation (when it was installed, maximum power, number of panels etc.) and the efficiency (total energy production and kWh/kWp). Also the dashboard offers insight in the financial yield of your solar panels and the realized CO² reduction. Where the reduction is not only shown in kilogram, but also the impact of this is shown in number of trees and households.
The dashboard compares the expected and actual realized energy production of the past 12 months and the current year. This way you get a direct insight in the efficiency of the installation(s). In the dashboard is also shown how many percent of the produced energy is for your own consumption and how many percent is delivered back to the power net.
Share your sustainable ambitions!
Your solar panels contribute to a sustainable company operation. If you want to share your sustainable ambitions with the users and visitors of your company, then you can use the ErbisOne Energydisplay in your entrance hallway, at the reception and in the canteen. You can then share the performance of your SolarPV installation in a visually attractive way and show how this contributes to the sustainability of your organization.