Users can use an extensive benchmark in ErbisOne. As soon as your organization has imported the data from your buildings and/or sections of the buildings in ErbisOne, you can start with the Benchmark. With this functionality you can see the energy performance of your buildings and sections in one overview, and you can perform an investigation to compare the performance of buildings and sections with each other in a straightforward way.
Why is benchmarking useful?
For organizations with multiple buildings, or with just one large building with different departments and where different kinds of processes take place, it is interesting to compare the energy performance of the buildings or sections with each other through a benchmark. With a benchmark, your organization gains a direct insight in the best and worst performing buildings or building parts. You see which buildings or building sections perform well energetically, and which sections may have to be optimized further. In some buildings ‘a bad energy performance’ can be explained, but in many cases the bad performance raises questions. By investigating this further, it becomes visible which buildings or building sections require extra attention. By also further analyzing the good performing buildings, success factors are set. With this knowledge the organization can improve the the energy performance of other buildings.
How does ErbisOne Benchmark work?
ErbisOne is created by experienced developers with extensive knowledge of monitoring and energy management. This you can clearly see in the plafform. The Benchmark is, like all other ErbisOne solutions, flexible and user friendly. In a simple way you can create a benchmark based on data which is relevant for your organization.
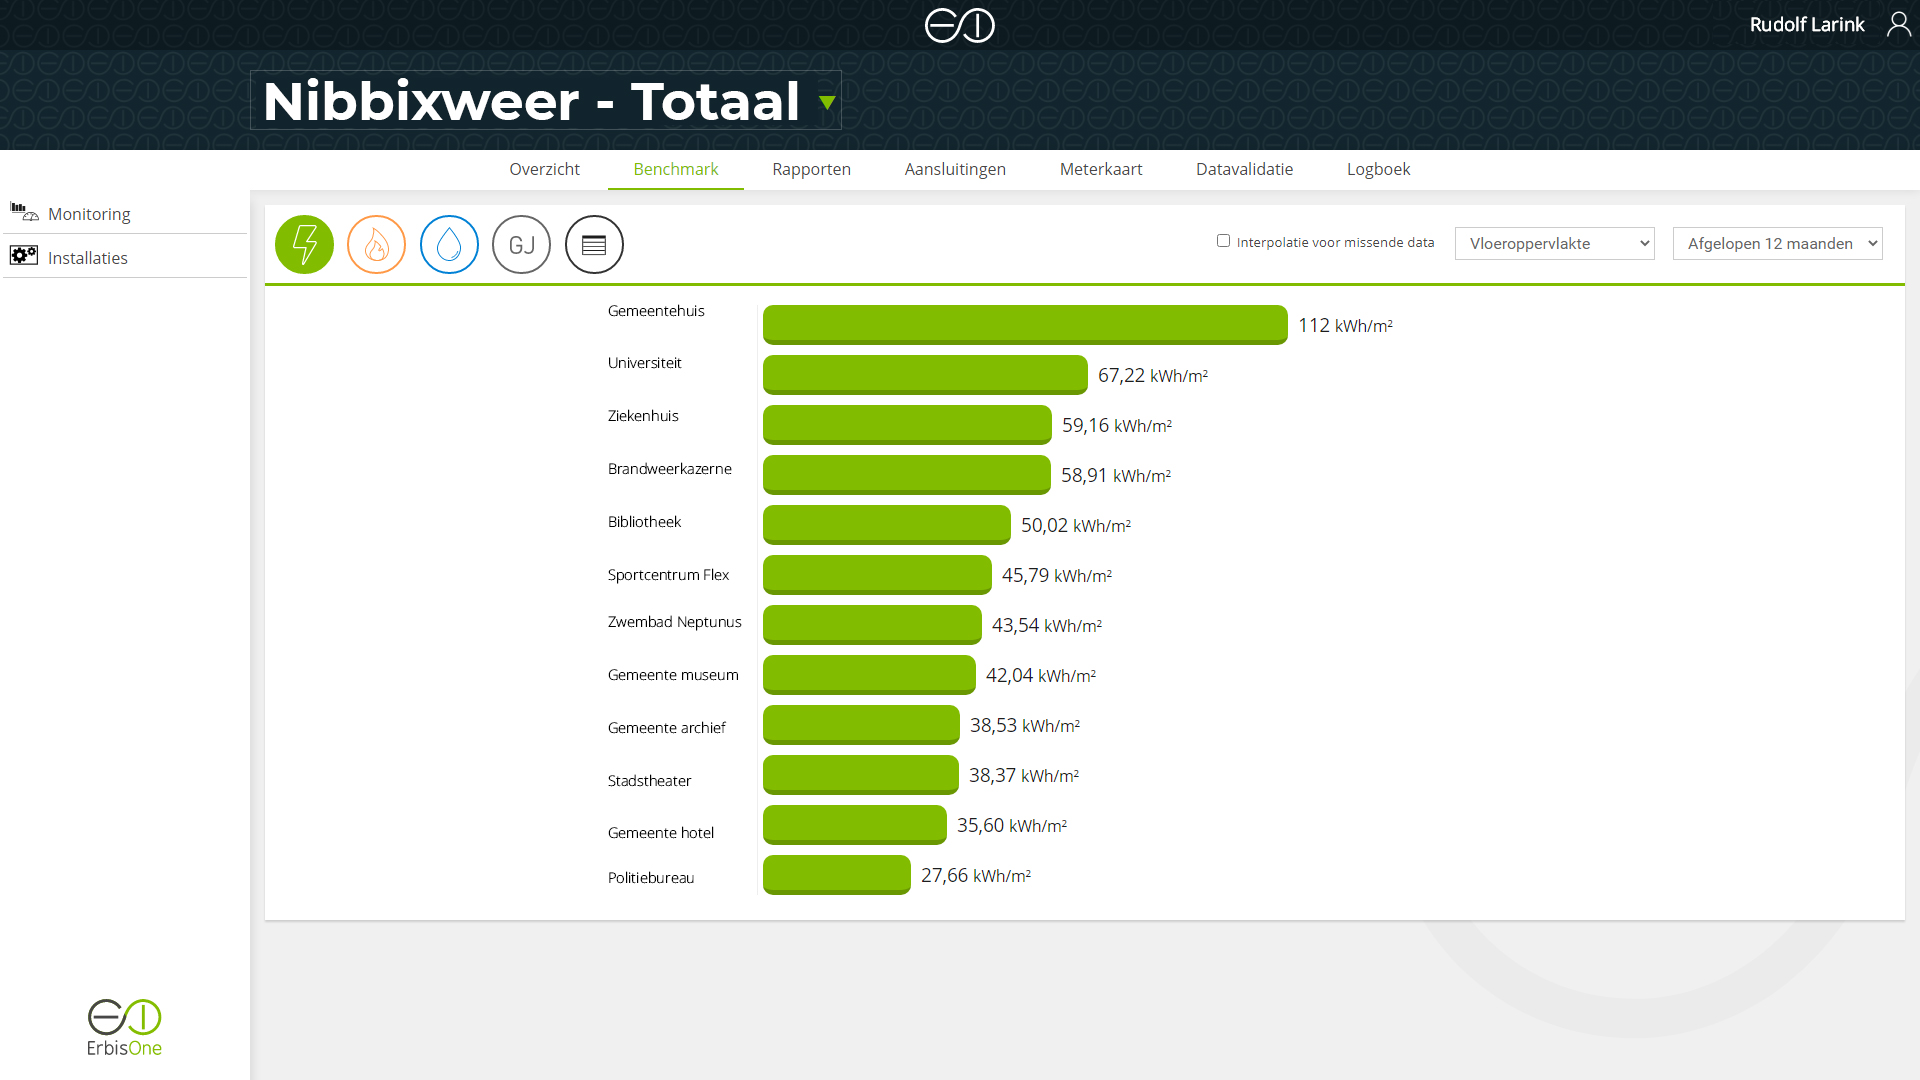
Choose the energy flows which are present in your buildings
With the Benchmark your buildings are compared to each other based on the existing energy flows (like electricity, gas, water, heating et cetera). You can easily select these energy flows in the ErbisOne Portal. Then select the period where the comparisons have to take place. Then you have to make a choice between ‘a comparison of the totals’ or ‘a comparison set against the surface of the buildings’. If you select the second option, you can make a very detailed comparison.
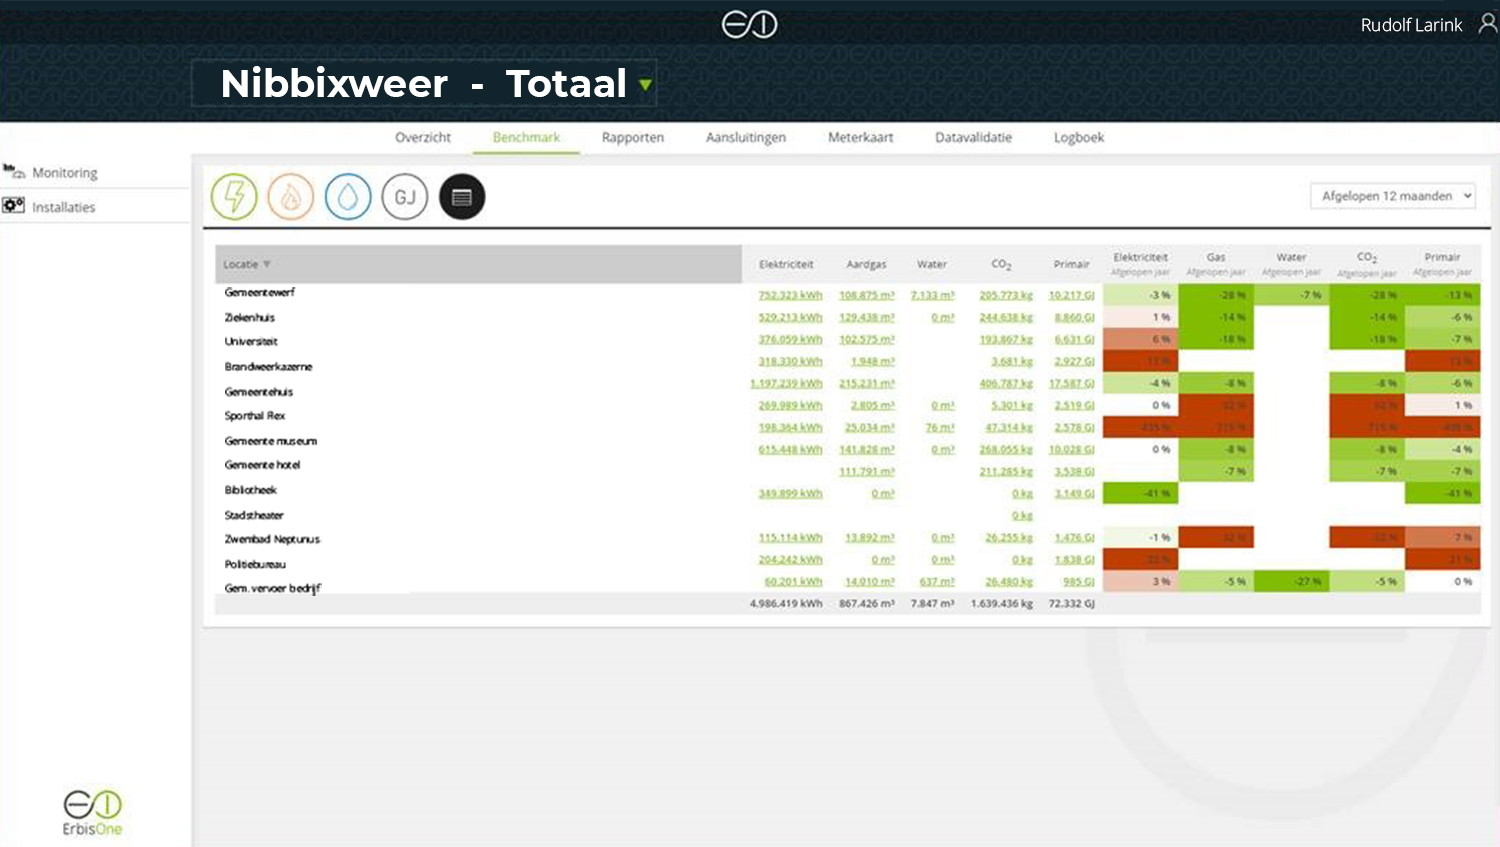
Comparison to consumption of the previous year
Besides a comparison per energy flow, the Benchmark also provides the possibility to make one total overview (see image below). With this overview you don’t only have insight in all energy flows per building, but also the comparison is made to the consumption of the previous year. This way you have insight in the energy performance of the current year and insight in the buildings with the least and most progression.